
Since submitting our ESV conference paper, we've made three improvements to DrivePulse's core detection algorithms: less aggressive event merging, generation-aware vehicle model names, and a new hockey-stick detector that catches rapidly emerging defects up to 171 days earlier. The result: our detected event database has grown from ~15,000 to over 32,000 events.
We recently featured DrivePulse's system at the 28th Enhanced Safety of Vehicles Conference. In our conference paper we laid out the statistics and machine learning that goes into our core defect discovery system. But paper publication timelines are much slower than the pace of a technology startup. We've made several improvements to our algorithms and data model since submitting our ESV paper. They are:
The end result is a system that is more responsive to and representative of the real world. But it also roughly doubled the number of events we detected. The state of the database we used to write our ESV paper had about 15,000 detected defect events. The current database, after all three changes, sits at over 32,000 events as of this writing. In this post, I'll detail each of the changes.
ESV algorithm: Events where the end date of one was within 365 days of the start date of another with the same make, model, and component were merged into one single event.
Problem: Manual inspection of events revealed that in some cases, two distinct events, about different failure modes, were merged into one.
Multifaceted cause: We hypothesize that this happens for two different reasons.
First, without generation information (discussed in the next section), the system doesn't know the difference between, for example, a 1995 Toyota Camry and a 2015 Toyota Camry. As far as the system is concerned, they're both named "Camry" and therefore one vehicle. If, again for example, the 1995 Camry and 2015 Camry happen to develop an issue with their engine in roughly the same time period, then the system only sees one event.
Second, visual inspection of the indicator curve (called P-Indicator in the ESV paper) reveals a "dip" between two events that were merged into one. This means that the system initially correctly detected two distinct events, but our merging algorithm grouped them into one because the end date of the first event was within 365 days of the second. We noticed this in the case of the Pontiac Grand Am in the analysis of the GM ignition switch incident, pictured.

The change we implemented at this stage addressed the second cause.
So we simply cut the merge rule in half. Events that are within 180 days of each other are still collapsed into one. Events with a gap of more than 180 days between them are left alone. You can see from the picture below, that this solves the Grand Am ignition switch issue. But this also grew the number of events we detect in the database from about 15,000 to 23,000, more than a 50% increase.

To get a sense of what this change looks like in practice, consider the Honda Accord (2013–2017) visibility category. The 2013 Accord generated a sustained run of complaints from early 2013 through mid-2015 — windshield distortion, wiper design flaws, water pooling on mirrors. After a quiet period of about 363 days, complaints resumed in August 2016 on a different set of concerns: rear-window distortion, rearview camera reliability, and driver-side mirror design. Under the 365-day rule, these were one event. Under the 180-day rule, they are correctly recorded as two distinct events pointing to two distinct failure modes — one fixed in the 2015 model year refresh, one emerging after it.
Similarly, the Honda Odyssey (2018–2026) electrical system produced two separate events separated by nearly a year. The first, ending in January 2022, was dominated by infotainment failures and engine stalls. The second, beginning in January 2023, centered on water intrusion through the rear tailgate and the downstream electronics failures that followed. These are mechanically unrelated issues that happened to affect the same model platform. Merging them into one event would have obscured both.
ESV algorithm: We take model names from the NHTSA complaints data directly, with only light editing.
Problem: As stated above, the result is that the system is unable to differentiate between models of different generations that happen to have the same marketing name. (e.g., Toyota Camry, BMW 325i, Ford Mustang, etc.) We can't simply append the model year to the model name as that would give us the opposite problem. We'd have too many distinct automobile models and the system would have trouble detecting signal from noise with such sparse data.
We're tackling this problem in three stages, one complete, one in ongoing development, and one left for the future.
What's done: We handed the models from the 50 makes with the most complaints in the NHTSA complaints data off to our favorite LLM for help. We still largely took the model names as they are from the NHTSA database but asked the LLM to incorporate generation information.
It used a combination of its own embedded knowledge (these are trained on almost the whole internet, after all) and heuristics drawn from model year information in the NHTSA complaints data. The result was a jump from 23,000 to roughly 30,000 events in our database. Since each event is defined by the triplet of make + model + component, and our models are now more granular, we get more events.
What's ongoing: One limitation of the above is taking the model names as they are from the NHTSA data. Often these model names contain granularity indicating trim configurations that might be relevant for one component (maybe) but are definitely irrelevant for others. We are in the process of working with our LLM assistants to develop more canonical model names that include relevant information but exclude others.
Some examples are:
This push is part of our efforts to bring the forum data into production. Unlike NHTSA complaints data, enthusiast forum posts don't come with make/model/year/component tagged. So, we're building classifiers to tag each post with that info — and whether the post is about a defect.
Simplifying the model names, removing trim, etc., makes building those classifiers easy and helps DrivePulse detect more meaningful signals.
What's left: The ultimate authorities on model names are the people doing the analysis, OEMs, regulators, insurers, suppliers, etc. Input from our customers will help DrivePulse provide them with the most relevant data to their needs.
ESV algorithm: The P-Indicator measures whether a vehicle–component's complaint rate is elevated relative to its historical norm. Event detection works by testing whether that elevation has been sustained: a rolling 180-day window must consistently sit above the detection threshold before an event is flagged. Adjacent flagged periods within 365 days (later 180 days, per the change above) are merged into one event.
Problem: This design has an inherent structural lag. A defect can begin generating complaints and causing a sharp rise in the P-Indicator weeks or months before the rolling window accumulates enough sustained signal to trigger. The algorithm is not broken — it is working as designed. But for defects where complaints arrive suddenly and in volume, the system was leaving meaningful lead time on the table.
The shape of this pattern is easy to recognize visually. The P-Indicator shoots up rapidly from near zero to near one, holds there, and then the sustained-detection window eventually catches up. It looks like a hockey stick.
The fix: We added a second detection stage that looks specifically for this hockey-stick shape. For each daily P-Indicator value, we check two conditions simultaneously:
When both conditions are met, that point is flagged as a "hockey stick" episode. Consecutive flagged points within 3 days of each other are grouped into a single episode. Then we apply a merge rule: if a hockey-stick episode begins within 180 days before an existing sustained-detection event's start date, we pull that event's start date back to the episode onset. If a hockey-stick episode falls within the most recent 180 days of data and does not anchor to any existing event, it is added to the database as a new standalone event — provided it lasted at least 7 days, which filters out noise and isolated spikes.
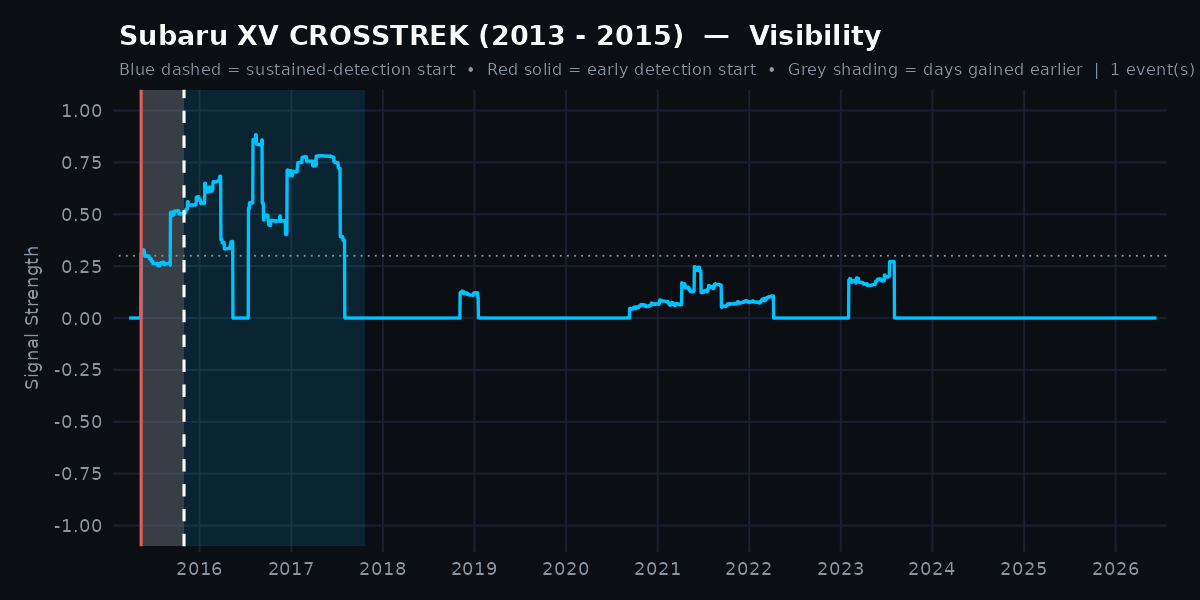
The two charts below illustrate this.
For the Subaru XV Crosstrek (2013–2015) visibility category, the P-Indicator rose sharply in May 2015 and held elevated through mid-2017. The sustained-detection algorithm did not flag the event start until October 2015, after 180 days of accumulated signal. The hockey-stick detector flagged the onset 171 days earlier. The grey shaded region between the red line (hockey-stick detection) and the blue dashed line (sustained detection) is the lead time gained.

The Subaru WRX (2022–2025) shows a cleaner case: the P-Indicator was flat near zero for years, then shot nearly vertically to 1.0 in late 2025. The hockey-stick detector (red line) precedes the sustained-detection start (blue dashed line) by 86 days.
To validate the algorithm and tune its parameters, we ran it across the full corpus of detected events for all Subaru Crosstrek and WRX generations — 85 events in total. We ran a parameter sweep across 81 combinations of rise window, minimum rise threshold, and minimum episode duration. The combination with the best profile — maximum events detected earlier, zero spurious standalone detections — yielded:
The algorithm is now integrated into the DrivePulse detection pipeline with these validated defaults. The roughly 2,000 additional events since the generation-info change (from ~30,000 to 32,000+) are a combination of new standalone hockey-stick events and events whose adjusted start dates now fall in a date range that previously excluded them from the database.